The implications of the following graph speaks for itself:
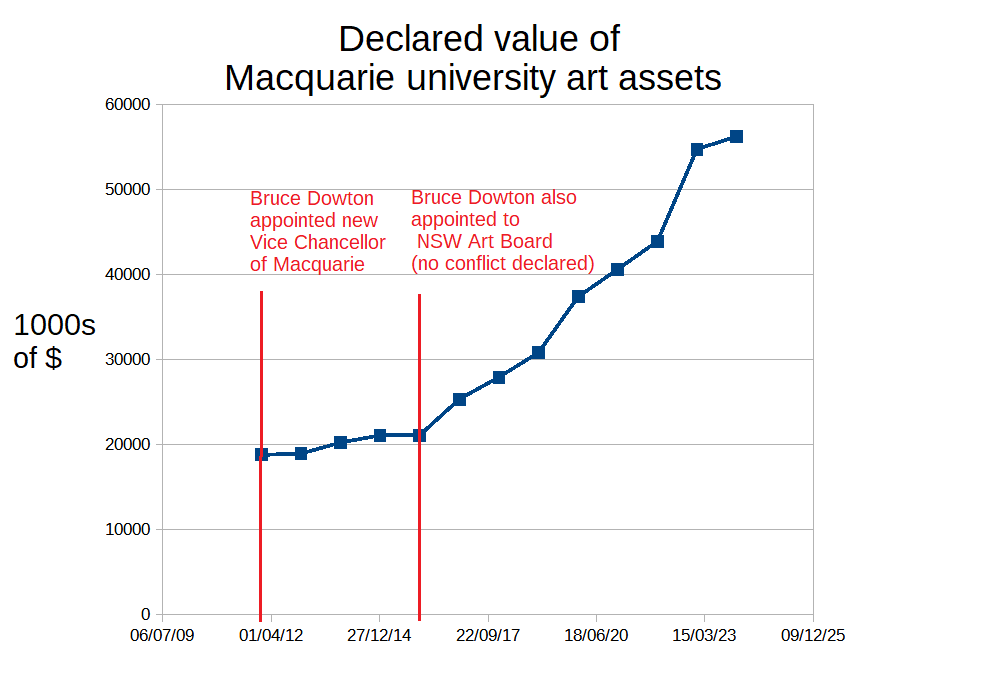
Source: Macquarie University Annual Report 2012 (pg 87-90), 2013 (pg 87-90), 2014 (pg 83-86), 2015 (pg 88-91), 2016 (pg 76-79), 2017 (pg 77-80), 2018 (pg 41-42), 2019 (pg 47-49), 2020 (pg 45-48), 2021 (pg 49-51), 2022 (pg 62-63) and 2023 (pg 60-61).
We have a lot more evidence than just this circumstance, but we will have to refrain from posting it for now.